Calculating Aspera Server Usage Volume using Aspera Console
Calculating Aspera Server Usage Volume using Aspera Console
Introduction
IBM Aspera software helps organizations transfer data around the world at high speed, regardless of file size, distance, or network conditions. There are several licensing models available, and many customers are seeing the benefits of moving to a volume-based license, which allows for an unlimited number of server installs and removes speed restrictions. Because this license model is based on how much data is transferred over an annual period, it may be useful to gather information on your existing Aspera server usage. In this article, we will use IBM Aspera Console to run a report.
Procedure
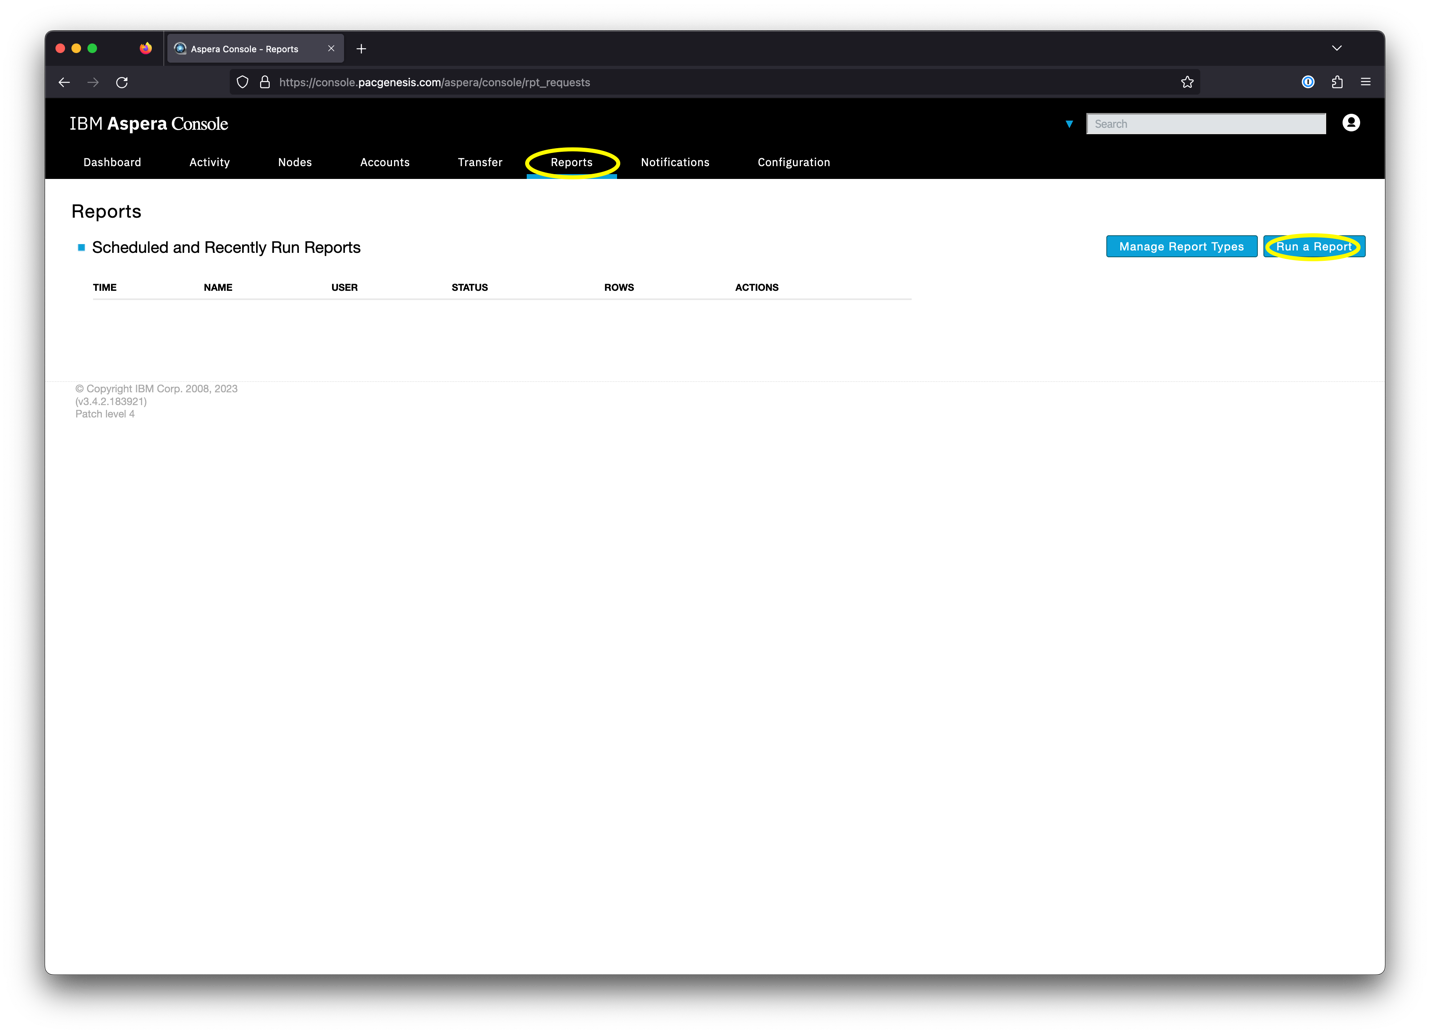
Log in to your Aspera Console interface, click Reports on the top menu bar, then Run a Report:
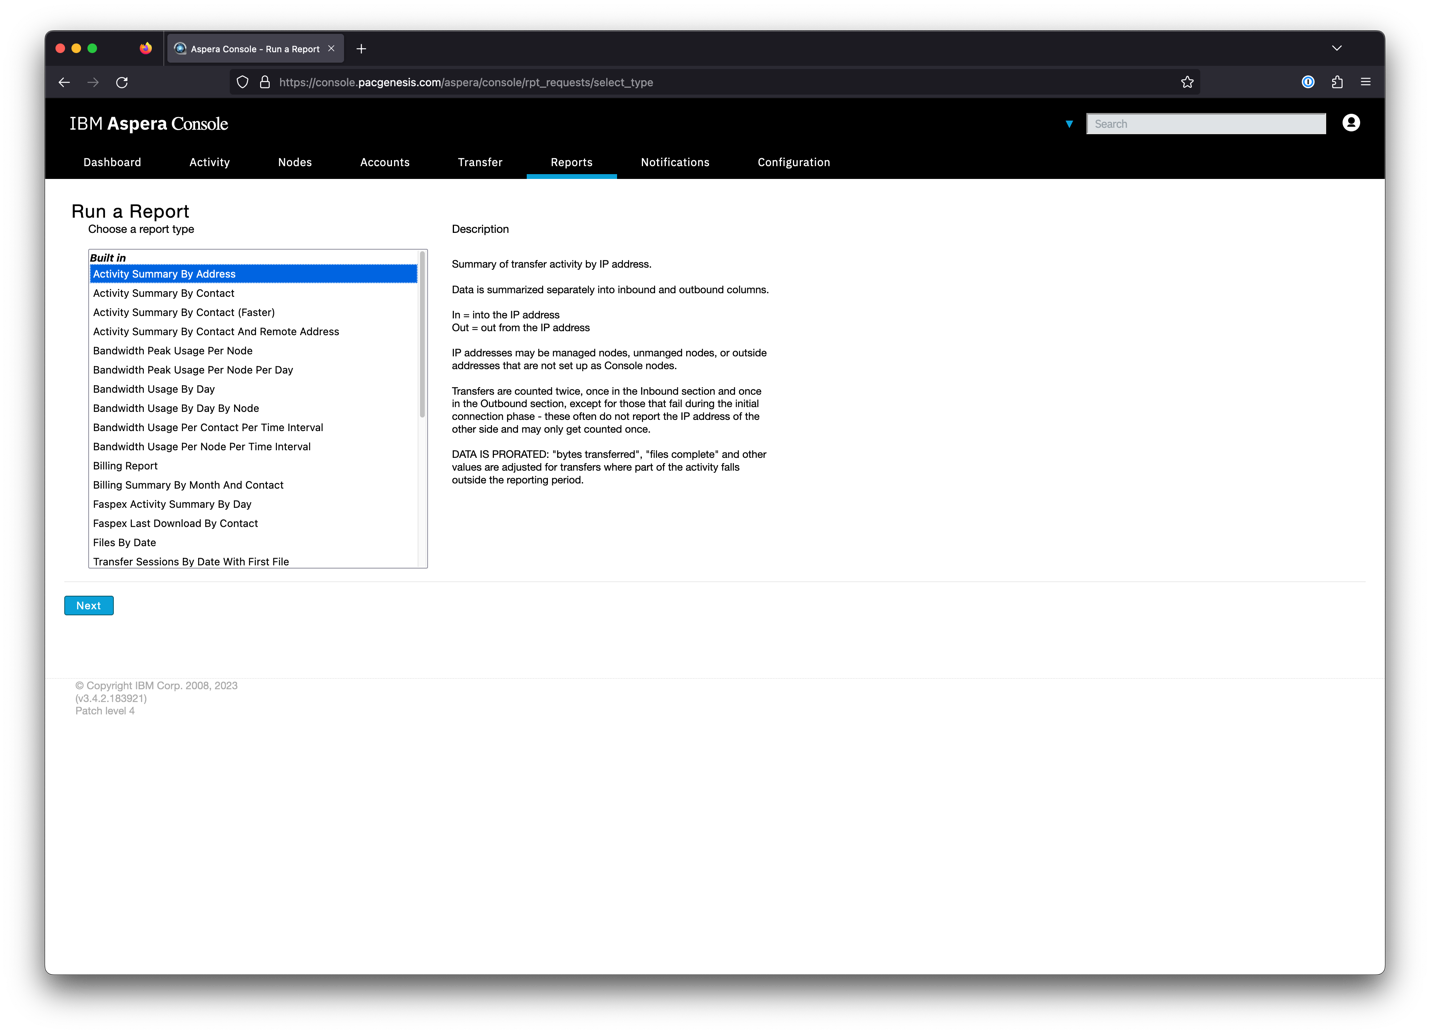
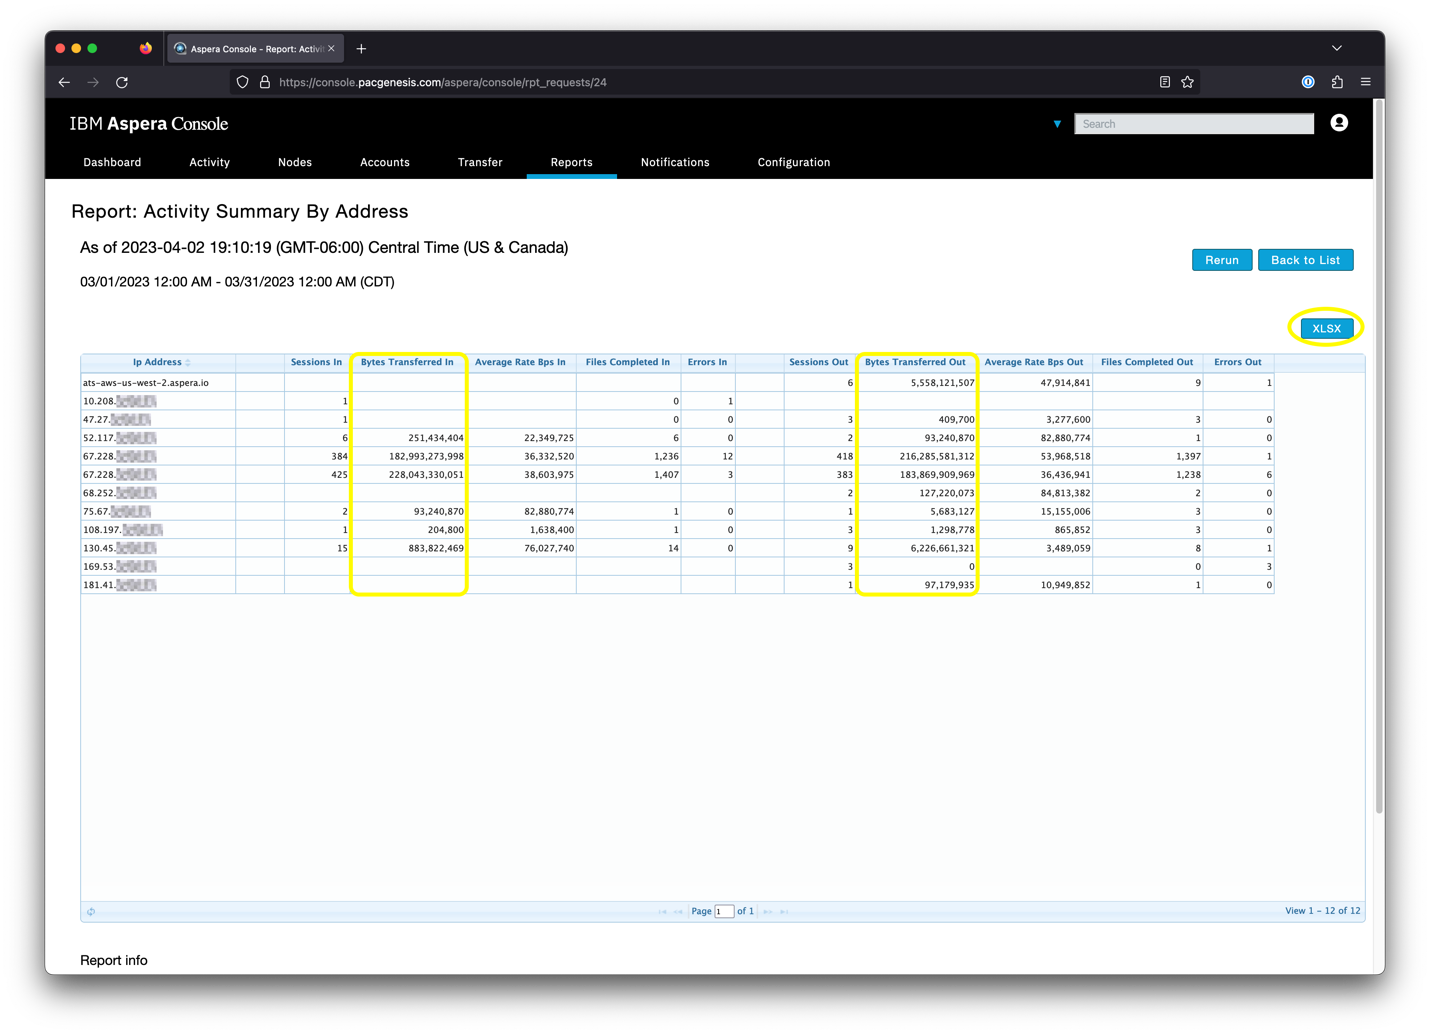
Console offers a number of built-in reports, along with the capability of designing your own report. For this example, we will run the Activity Summary By Address report, which will break down how much inbound and outbound transfer activity occurred during the reporting period, organized by IP address. Select that report name, then click Next:
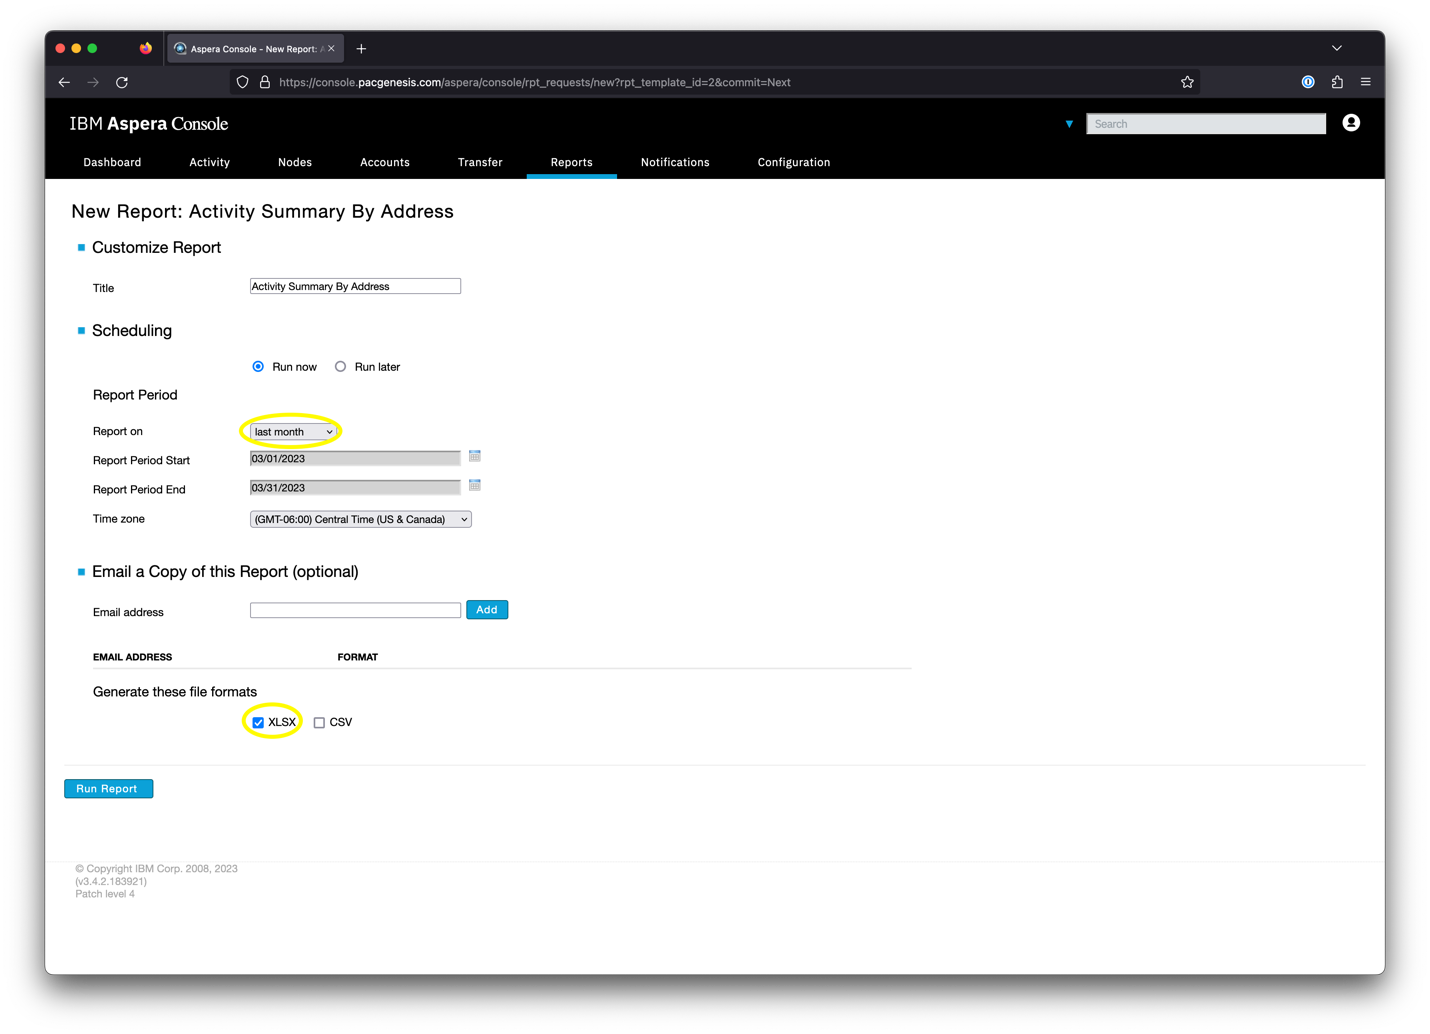
On the next screen, we will define the reporting period. You may be able to select an entire 12-month period here. Depending on your Aspera Console configuration and how much activity your servers generate, this may take a long time to calculate, or your Console may be automatically purging transfer activity data on a periodic basis. For our example, we’re going to run a report for last month’s data – our transfer activity is fairly consistent throughout the year, so we will take last month as typical and multiply by 12 to estimate annual usage. For Report Period, choose Last Month from the drop down menu. Check the box next to Generate these file formats XLSX so we can also have a spreadsheet for calculating sums, the click Run Report:
Once your report finishes running, the results will be displayed on the page. You’ll see a number of host addresses on the left hand side along with data for both uploads (Bytes Transferred In) and downloads (Bytes Transferred). Calculating the sum for each column will help with estimating your total usage over the time period. Click on the XLSX button on the right hand side to download the report data in spreadsheet format for easier calculation.
Conclusion
Sampling one month of data is useful for many customers, but be sure to take into account any seasonal variability your business may have where some months are more active than others. It can also be useful to build in room for growth, as file sizes and volumes tend to increase over time.
Contact Us
The PacGenesis team is happy to help answer any questions and work with you directly to make sure that your annual license plan covers your expected usage and makes financial sense. Please reach out to us via sales@pacgenesis.com.